1.How to make money on cryptocurrencies?
2. Analysis of Bitcoin futures volume on Chicago Mercantile Exchange
3. Trend analysis.
4. Japanese candlestick analysis.
5. Conclusion. Statistics.
1.How to make money on cryptocurrencies?
To make money on trading in the cryptocurrency market, three components are needed: a trading system, money management, and risk management. Let's continue to consider the effective methods of money management:
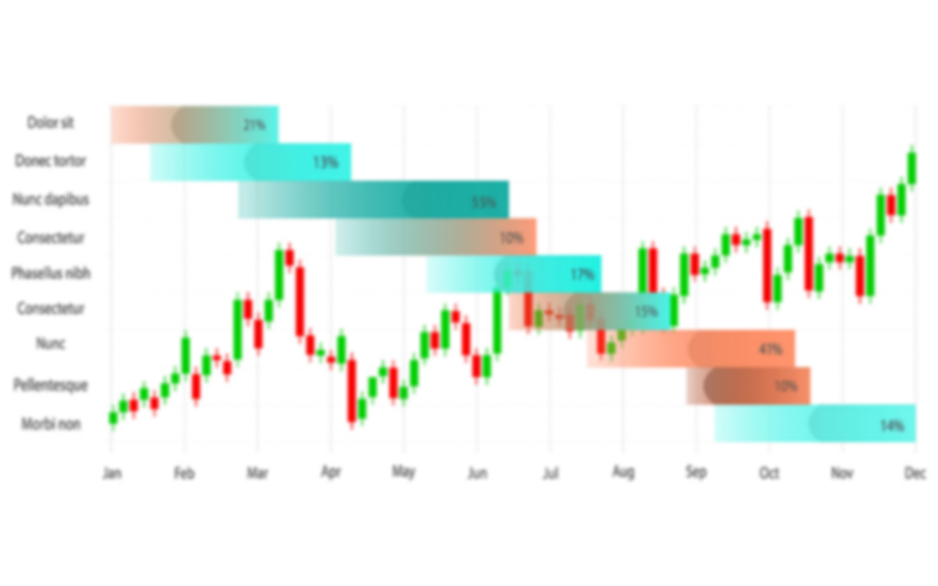
The Multiple Lots method - multiple trades as the trend develops. This method implies the opening of several positions in turn. The first trade can be opened immediately after the price turns around, forming a new trend. The second trade can be opened after the first correction in the new trend. If necessary, subsequent trades are opened in the same way. When the trend comes to an end, all positions are closed simultaneously. Thus, this approach allows you to gradually build up positions in case the forecast suggesting the development of a new trend is met.
The figure shows an example of opening trades using the Multiple Lots method.
This method can be used for trending markets, including the cryptocurrency market. After opening the second trade, the first one can be moved to the break-even point or you can lock in part of the profit. Thus, even if the trend is completed, profits from the first trade can offset losses from the second one. This method is perfect for both long-term and short-term trading. It is considered conservative and should always be supported by stop-loss orders. If the forecast suggesting the development of a new trend is not met, the position should be closed by the SL orders. Trade conservatively and you will be able to stay in the market for a long period of time. Time is what you need to become a professional trader.
2. Analysis of Bitcoin futures volume on Chicago Mercantile Exchange.
Bitcoin has started to fall dramatically, outpacing many other cryptocurrencies. Apparently, the price has entered a great correction. If so, we will see a strong downward trend, while trends help us make a profit. Let's consider the levels of the maximum traded volumes based on the Chicago Mercantile Exchange. These indicators show the activity of major market players.
21.04.21 - The level of the maximum traded volume (POC - Point Of Control) - 55575
22.04.21 - The level of the maximum traded volume (POC - Point Of Control) - 53725
The POC has moved down, the price is below the maximum traded volume. The market is moving in a downward trend. In such a situation, according to the volume analysis, you can open short positions.
3. Trend analysis.
The second step in this analysis is to determine the short-, medium-, and long-term trend. It is worth opening trades when the direction of all three trends coincides. Trend analysis is carried out with the help of an exponential moving average:
EMA 1152 (blue) shows the long-term trend on the H1 chart, which is similar to EMA 48 on the D chart;
EMA 288 (red) shows the medium-term trend on the H1 chart, which is similar to EMA 48 on the H4 chart;
EMA 48 (black) shows the short-term trend on the H1 chart.
The price is below the short-term, medium-term, and long-term EMAs. Apparently, a downward movement is developing in the market. Therefore, according to the trend analysis, it is possible to open short positions today.
4. Japanese candlestick analysis.
Market analysis with the help of Japanese candlesticks is the third step in this trading system. Let's analyze yesterday's daily candlestick:
The candlestick has closed downwards, the candlestick is black. The low is below the low of the previous candlestick. The candlestick pattern matches the trend, it has a long body and small shadows. According to the Japanese candlestick analysis, you can consider sell orders.
5. Conclusion. Statistics.
Volume analysis - SELL.
Long-term trend - SELL.
Medium-term trend - SELL.
Short-term trend - SELL.
Japanese candlestick analysis - SELL.
Conclusion: On April 23, 2021, you can sell bitcoin as the different types of analysis provide the same forecasts.
To analyze the effectiveness of this trading approach, you should use statistics. Based on these forecasts, we track the data on completed transactions and open new deals in a separate account. Transactions are made on four instruments: Bitcoin, Ethereum, Litecoin, and BCHUSD. They are analyzed in the same way. Statement:
We have opened a new short position on bitcoin.
The risk is not more than 1% per trade, this approach is conservative. According to this system, a stop-loss order is placed beyond the daily low or high, depending on the direction of the trade. We do not set take-profit orders, enabling the price to grow without limits. We follow the trade, moving SL beyond the extreme points of the future sessions.
Since trading is carried out on the daily charts, this recommendation remains relevant throughout the day.
Trade along the trend and you will make a profit!