1. Volume analysis of LTC/USD from Binance
2. Long-term trend analysis
3. Mid-term trend analysis
4. Short-term trend analysis
5. Japanese candlestick analysis
6. Conclusion
7. Statistics
1. Volume analysis of LTC/USD from Binance
The analysis is based on Binance 's traded volume data on the daily chart. The analysis is carried out based on the footprint-profile theory. According to the theory, the intraday movement of the highest traded volume level can indicate the likely direction of the trend. The highest traded volume is the level with the largest number of transactions carried out. That is, it is the level of major market players. Thus, if the highest traded volume goes up, it indicates an bullish trend. Otherwise, if the level goes down, it indicates a bearish trend. Chaotic movements signal that the market is flat.
17.05.21 – the level of the highest traded volume (POC – PointOfControl) – 274
18.05.21 – the level of the highest traded volume (POC – PointOfControl) – 304
The POC has moved upward. The price is below two POC levels. The market is moving in a bullish trend. You can sell the pair today.
2. Long-term trend analysis
A trend is your friend. Many traders are aware of this saying but do not know how to use it. The answer is simple: trade only with the trend. Thus, your trades will be more profitable and less risky. According to the classic Dow theory, there are three main trends:
long-term
medium-term
short-term
These particular trends should be analyzed before you enter the market. Now, let's take a look at them.
The long-term trend is the daily trend. In this case, trades are conducted on the daily chart and are held for several days. The analysis of the daily trend is made with the help of the 48-period exponential moving average (EMA 48). If the daily candlestick closes above EMA 48, it will indicate the bullish trend, and long positions can be considered. Otherwise, if the daily candlestick closes below EMA 48, it is the bearish trend, and you should enter short positions.
The price is in line with EMA 48. It is a sideways long-term trend. That is why you should consider entering long and short positions.
3. Mid-term trend analysis
The mid-term trend is the one on the 4-hour chart (4H). In this case, we will analyze the trend by using EMA 48. If the candlestick closes above EMA 48 on the 4H chart, it will indicate the bullish trend. Thus, you should enter long positions. Otherwise, if the candlestick closes below EMA 48 on the 4H chart, it is the bearish trend. Consequently, you should enter short positions.
The price is below EMA 48. It is a bearish mid-term trend. You should enter short positions.
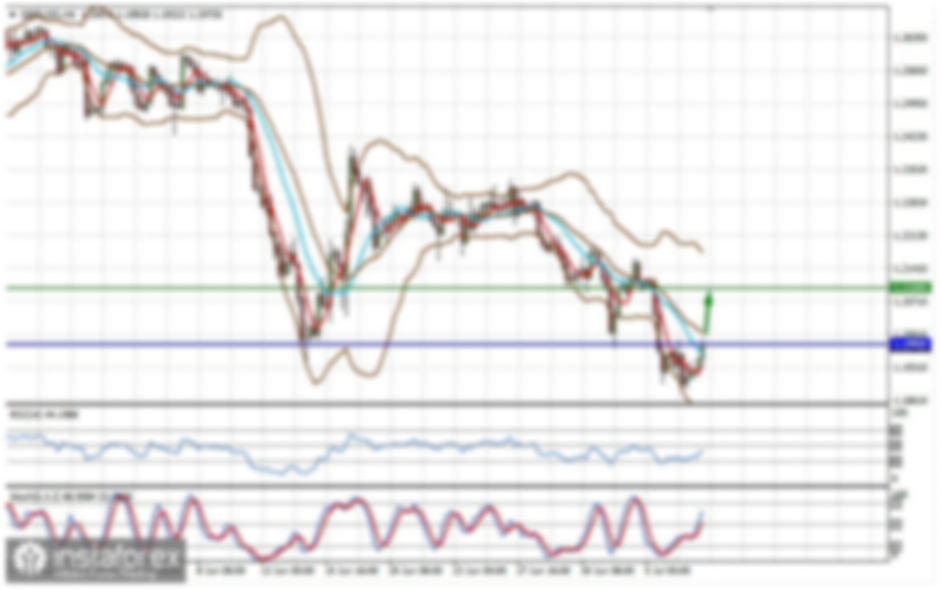
4. Short-term trend analysis
A short-term trend is the trend in the H1 time frame. Moreover, it can show an entry point into the market. We turn to EMA 48 again. If the candlestick closes above EMA 48 on the H1 chart, it will indicate the upward trend. Thus, you should enter long positions. Alternatively, if the candlestick closes below EMA 48, it will indicate the downward trend. Consequently, you should enter short positions.
The price is below EMA 48. It is a bearish short-term trend. This means you can buy and sell the instrument. The long-term trend, the mid-term trend, and the short-term trend are not in line.
5. Japanese candlestick analysis
A classic Japanese candlestick analysis is applied to the daily time frame. The daily candlestick is analyzed.
The white daily candlestick has closed upward. Its high is above the previous candlestick's high. It is a Doji candlestick pattern, having a short body and large shadows. Based on Japanese candlestick analysis, long and short positions can be considered.
6. Conclusion
- Volume analysis – SELL.
- Long-term trend analysis – BUY/SELL.
- Mid-term trend analysis – SELL.
- Short-term trend analysis – SELL.
- Japanese candlestick analysis – BUY/SELL.
Conclusion: You can buy and sell LTC/USD on May 19, 2021, as various analyses provide different forecasts.
7. Statistics
To analyze how effective this approach is, the data on completed transactions is tracked. The forecast is made for four instruments: Bitcoin, Ethereum, Litecoin, BCH/USD. 3-months gains: 9.1%. Drawdown: 4.88% Statement:
I do not open new trades due to market uncertainty.
The risk per trade is 1% of a deposit. A Stop Loss for new trades is placed beyond the daily extreme points. We do not set a Take Profit because we will continue to move a Stop Loss above the extreme points of the upcoming sessions.
Since trading is carried out on daily charts, this recommendation is relevant throughout the day.
Trade with the trend and generate profits!