


signal strength 2 of 5
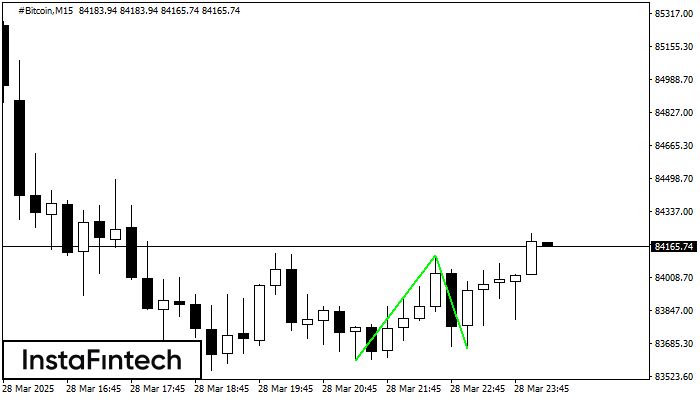
The Double Bottom pattern has been formed on #Bitcoin M15. This formation signals a reversal of the trend from downwards to upwards. The signal is that a buy trade should be opened after the upper boundary of the pattern 84119.35 is broken. The further movements will rely on the width of the current pattern 51812 points.
The M5 and M15 time frames may have more false entry points.
See Also
- All
- Double Top
- Flag
- Head and Shoulders
- Pennant
- Rectangle
- Triangle
- Triple top
- All
- #AAPL
- #AMZN
- #Bitcoin
- #EBAY
- #FB
- #GOOG
- #INTC
- #KO
- #MA
- #MCD
- #MSFT
- #NTDOY
- #PEP
- #TSLA
- #TWTR
- AUDCAD
- AUDCHF
- AUDJPY
- AUDUSD
- EURCAD
- EURCHF
- EURGBP
- EURJPY
- EURNZD
- EURRUB
- EURUSD
- GBPAUD
- GBPCHF
- GBPJPY
- GBPUSD
- GOLD
- NZDCAD
- NZDCHF
- NZDJPY
- NZDUSD
- SILVER
- USDCAD
- USDCHF
- USDJPY
- USDRUB
- All
- M5
- M15
- M30
- H1
- D1
- All
- Buy
- Sale
- All
- 1
- 2
- 3
- 4
- 5
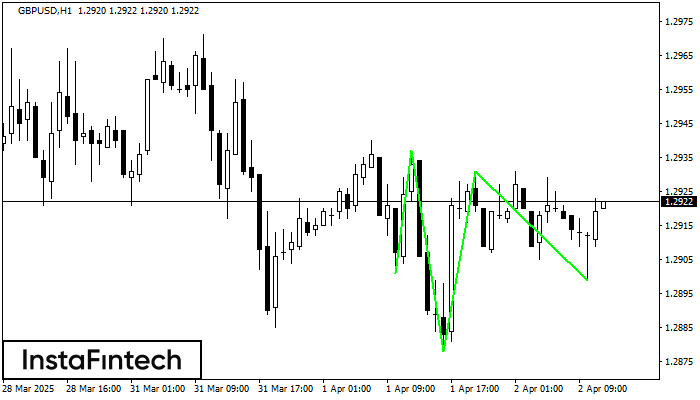
According to H1, GBPUSD is shaping the technical pattern – the Inverse Head and Shoulder. In case the Neckline 1.2937/1.2931 is broken out, the instrument is likely to move toward
Open chart in a new window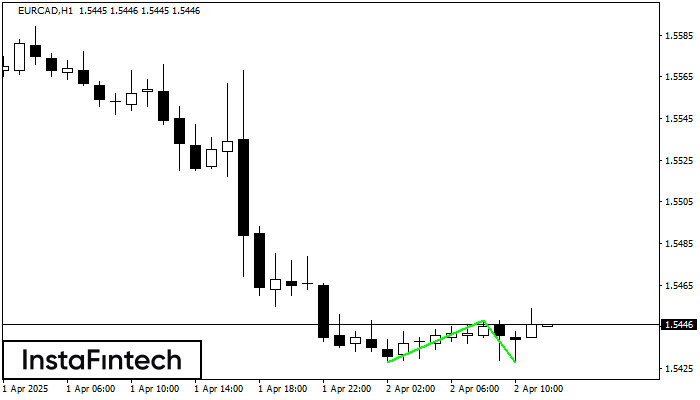
The Double Bottom pattern has been formed on EURCAD H1; the upper boundary is 1.5448; the lower boundary is 1.5428. The width of the pattern is 20 points. In case
Open chart in a new window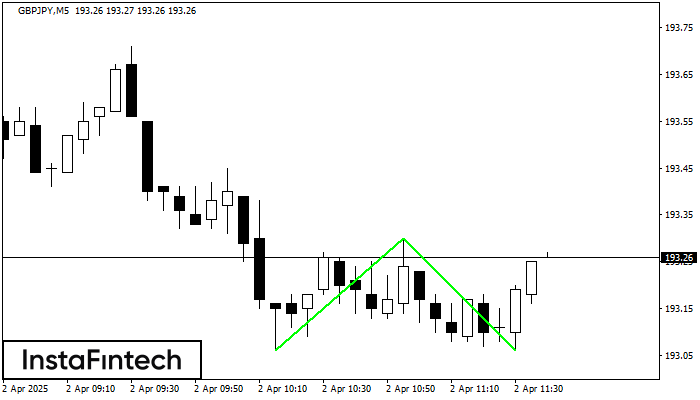
The Double Bottom pattern has been formed on GBPJPY M5; the upper boundary is 193.30; the lower boundary is 193.06. The width of the pattern is 24 points. In case
The M5 and M15 time frames may have more false entry points.
Open chart in a new window


