Analysis of Thursday's Trades
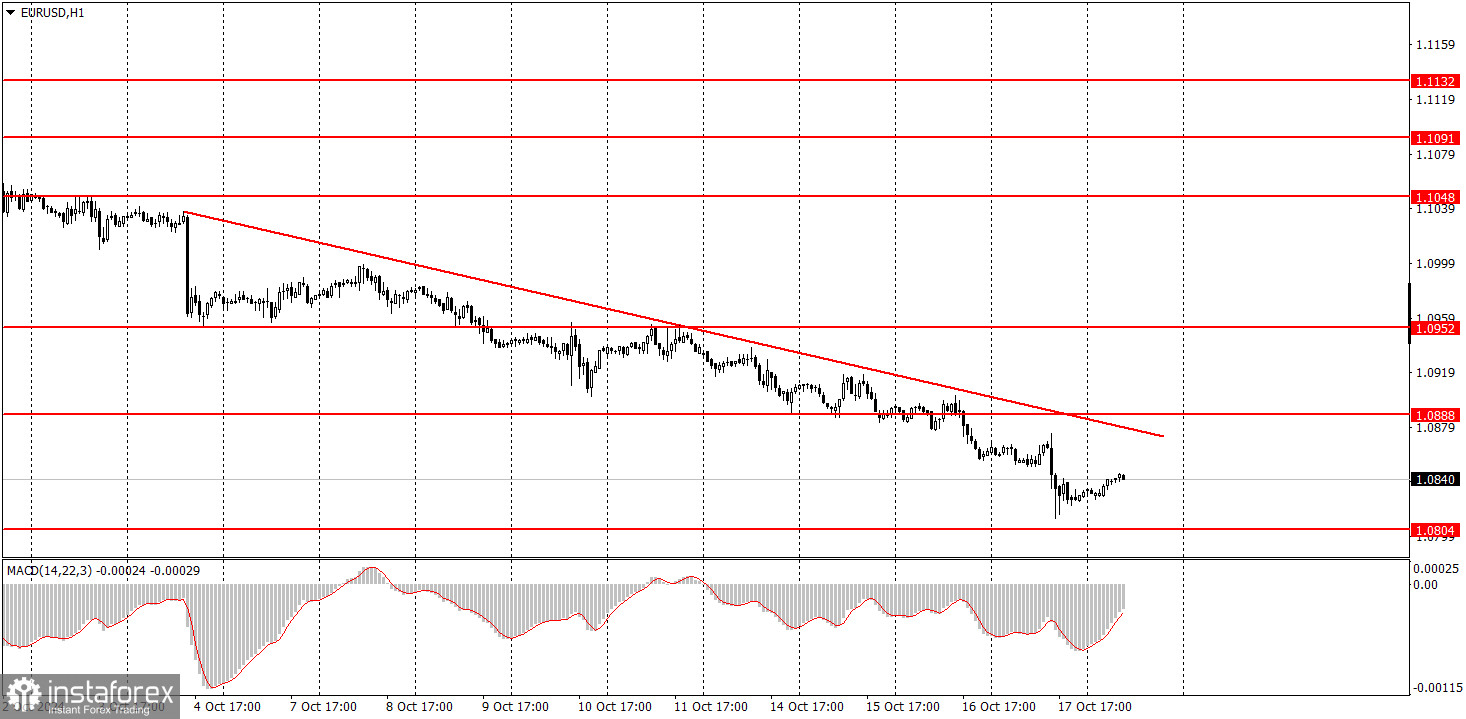
1H Chart of the EUR/USD Pair
The EUR/USD currency pair continued its downward movement on Thursday. The euro fell before the European Central Bank meeting, during the ECB meeting, and after it. As mentioned, the fundamental and macroeconomic background is not currently crucial for the euro. The euro is so overbought and unjustifiably expensive that it can continue declining without news and reports. This is precisely what we are observing now. After the ECB meeting, we considered that the euro could rebound upward, as the market might have already priced in the rate cuts. However, as we can see, this did not happen, as the ECB's rates are not significant for the market. Additionally, Christine Lagarde suggested that the central bank might carry out another monetary easing in December, so the euro sell-off did not stop. For now, no single technical signal indicates an impending correction. The euro continues to slide lower each day, which is entirely logical.
5M Chart of the EUR/USD Pair
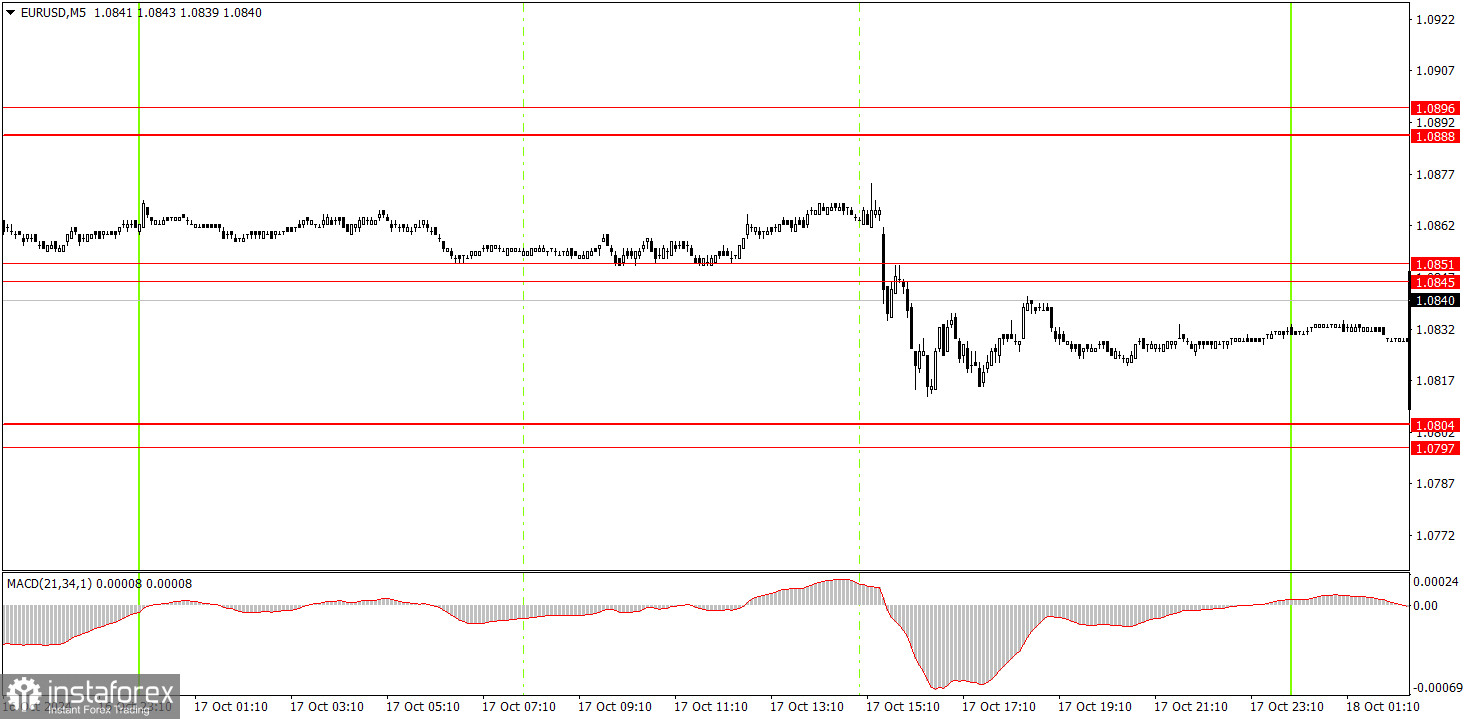
On Thursday, a single signal formed in the 5-minute time frame, but it occurred during the announcement of the ECB meeting results and half an hour before Lagarde's speech. Entering the market at that moment was risky, to put it mildly. Thus, yesterday, the best decision was to stay out of the market. The pair's volatility remains very low, significantly complicating trading in the lower time frames.
How to Trade on Friday:
On the hourly time frame, the EUR/USD pair continues to take its first steps toward a new downtrend. Now, this step looks more like a leap. Unfortunately, illogical dollar sales could resume in the medium term since no one knows how long the market will continue to price in the Federal Reserve's monetary easing. However, a downtrend is present in the hourly time frame. Further declines in the euro can be expected even without a correction, as it remains incredibly overbought, although a correction would look better.
On Friday, trading can be conducted from the 1.0845-1.0851 area. Today, there is no fundamental and macroeconomic background, so strong movements are unlikely.
On the 5-minute time frame, levels to consider are 1.0726-1.0733, 1.0797-1.0804, 1.0845-1.0851, 1.0888-1.0896, 1.0940-1.0951, 1.1011, 1.1048, 1.1091, 1.1132-1.1140, and 1.1189-1.1191. On Friday, no significant or interesting events are planned in either the Eurozone or the US. A few minor reports will be released in the US, but they are unlikely to trigger a market reaction of more than 30 pips.
Basic Rules of the Trading System:
- The strength of a signal is determined by the time it takes to form (bounce or break through a level). The less time it takes, the stronger the signal.
- If two or more trades were opened near a particular level based on false signals, all subsequent signals from that level should be ignored.
- In a flat market, any pair can generate a lot of false signals or none at all. In any case, it's best to stop trading at the first signs of a flat market.
- Trades should be opened during the period between the start of the European session and the middle of the US session, after which all trades should be manually closed.
- In the hourly time frame, it's preferable to trade based on MACD signals only when there is good volatility and a trend confirmed by a trendline or trend channel.
- If two levels are very close to each other (between 5 and 20 pips), they should be treated as a support or resistance zone.
- When moving 15 pips in the intended direction, a Stop Loss should be set to breakeven.
What's on the Charts:
Support and Resistance Price Levels: These levels serve as targets when opening buy or sell positions. They can also be used as points to set Take Profit levels.
Red Lines: These represent channels or trend lines that display the current trend and indicate the preferred trading direction.
MACD Indicator (14,22,3): The histogram and signal line serve as an auxiliary indicator that can also be used as a source of trading signals.
Important Speeches and Reports (always found in the news calendar) can significantly impact the movement of a currency pair. Therefore, trading should be done with maximum caution during their release, or you may choose to exit the market to avoid a sharp price reversal against the preceding movement.
For Beginners Trading on the Forex Market: It's essential to remember that not every trade will be profitable. Developing a clear strategy and practicing money management is key to achieving long-term success in trading.