Forecast for August 3:
Analytical review of currency pairs on the H1 scale:
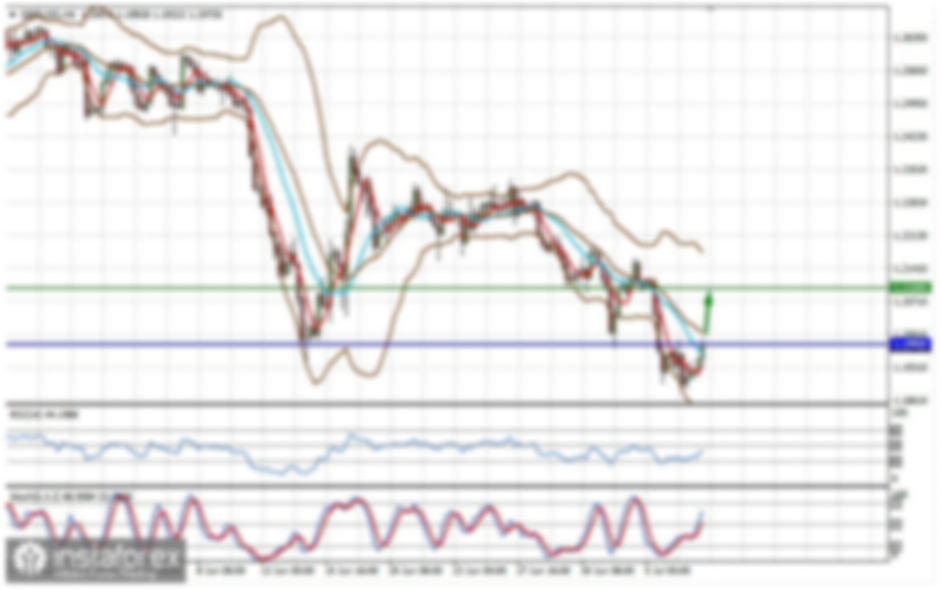
For the Euro/Dollar pair, the key levels are 1.1984, 1.1962, 1.1948, 1.1920, 1.1896, 1.1870, 1.1855, and 1.1833. We are following the development of the upward trend from July 23. The continuation of the upward movement is expected after the breakout of 1.1896, in this case, the target is 1.1920, with consolidation near this level. A breakout of the level of 1.1922 will lead to the development of a pronounced upward movement with the target at 1.1948, and price consolidation in the corridor 1.1948 - 1.1962. We consider the level of 1.1984 as a potential value for the high. Upon reaching this, we expect a rollback to the low.
A short-term downward movement is possible in the 1.1870 - 1.1855 corridor. A breakdown of the last value will lead to a deep correction with a target at 1.1833. This level is key support for the high.
The main trend is the upward structure from July 23
Key levels of structure development:
Upward resistance: 1.1896 Target: 1.1919
Upward resistance: 1.1921 Target: 1.1948
Downward resistance: 1.1870 Target: 1.1856
Downward resistance: 1.1853 Target: 1.1835
For the Pound/Dollar pair, the key levels are 1.4066, 1.4037, 1.3967, 1.3934, 1.3893, 1.3864, 1.3813, and 1.3781. We are following the development of the upward structure from July 20. A short-term upward movement, as well as consolidation, is expected in the 1.3934 - 1.3967 corridor. The breakout of the last value should be accompanied by a pronounced upward movement with the target at 1.4037. We consider the level of 1.4066 as a potential value for the high. Upon reaching this, we expect consolidation, as well as a rollback to the low.
A short-term downward movement is expected in the 1.3893 - 1.3864 corridor. A breakdown of the last value will lead to a deep correction with the target at 1.3813. The 1.3813 - 1.3781 range is the key support for the upward structure from July 20.
The main trend is the upward structure from July 20
Key levels of structure development:
Upward resistance: 1.3935 Target: 1.3966
Upward resistance: 1.3969 Target: 1.4035
Downward resistance: 1.3892 Target: 1.3866
Downward resistance: 1.3862 Target: 1.3815
For the Dollar/Franc pair, the key levels are 0.9127, 0.9102, 0.9083, 0.9053, 0.9036, 0.9002, 0.8988 and 0.8963. Here, we are following the development of the July 20 downward trend structure. A short-term downward movement is expected in the 0.9053 - 0.9036 corridor. The breakdown of the last value should be accompanied by a pronounced downward movement with the target at 0.9002, and consolidation in the 0.9002 - 0.8988 corridor. We consider the level of 0.8963 as a potential value for the low, upon reaching which, we expect a rollback to the high.
A short-term upward movement is possible in the 0.9083 - 0.9102 corridor. A breakout of the last value will lead to a deep correction with the target at 0.9127, which is the key support for the downward cycle.
The main trend is the downward cycle from July 20
Key levels of structure development:
Upward resistance: 0.9083 Target: 0.9101
Upward resistance: 0.9104 Target: 0.9125
Downward resistance: 0.9034 Target: 0.9004
Downward resistance: 0.8988 Target: 0.8965
For the Dollar/Yen pair, the key levels are 110.09, 109.72, 109.46, 109.22, 108.82, 108.51, and 108.19. We are following the development of the downward structure from July 23. We expect the continuation of the movement to the low after the breakdown of 109.20, with the target at 108.82. The breakdown of which, in turn, will allow us to count on a movement to the level of 108.51, with consolidation near this level. We consider the level of 108.19 as a potential value for the high, upon reaching this level, we expect a pullback into a correction.
A short-term upward movement is expected in the 109.46 - 109.72 corridor. The breakout of the last value will lead to a deep correction with the target at 110.09, which is the key support for the downward cycle.
The main trend is the downward structure from July 23.
Key levels of structure development:
Upward resistance: 109.46 Target: 109.70
Upward resistance: 109.75 Target: 110.07
Downward resistance: 109.20 Target: 108.86
Downward resistance: 108.80 Target: 108.53
For the Canadian dollar/US dollar pair, the key levels are 1.2594, 1.2531, 1.2495, 1.2429, 1.2364, 1.2327, and 1.2240. We are following the medium-term downward structure from July 19, at the current moment the price is in a correction. The continuation of the downward movement is expected after the breakdown of the level of 1.2429 with the target at 1.2364. There is a short-term downward movement in the 1.2364 - 1.2327 corridor, as well as consolidation. We consider the level of 1.2240 as a potential value for the low. The movement to which is expected after the breakdown of 1.2327.
A short-term upward movement is possible in the range of 1.2495 - 1.2531. A breakout of the last value will lead to a deep correction with the target at 1.2594, which is key support for the low.
The main trend is the downward cycle of July 19.
Key levels of structure development:
Upward resistance: 1.2495 Target: 1.2530
Upward resistance: 1.2534 Target: 1.2594
Downward resistance: 1.2427 Target: 1.2365
Downward resistance: 1.2363 Target: 1.2328
For the Australian dollar/US dollar pair, the key levels are: 0.7444, 0.7409, 0.7374, 0.7340, 0.7319, 0.7291, 0.7239, and 0.7214. We are following the upward structure from July 21. A short-term upward movement, as well as consolidation, are possible in the 0.7374 - 0.7409 corridor. A breakout of the last value will lead to the development of an upward potential from July 21, in this case, the first potential target is 0.7444.
A short-term downward movement is expected in the 0.7340 - 0.7319 corridor. A breakdown of the last value will allow us to count on a movement to the level of 0.7291, the breakdown of which, in turn, should be accompanied by a pronounced downward movement with the target at 0.7239. We consider the level of 0.7214 as a potential value for the low. Upon reaching this, we expect consolidation, as well as a rollback to the high.
The main trend is the downward cycle from July 6, the stage of correction.
Key levels of structure development:
Upward resistance: 0.7376 Target: 0.7407
Upward resistance: 0.7410 Target: 0.7444
Downward resistance: 0.7340 Target: 0.7320
Downward resistance: 0.7317 Target: 0.7292
For the Euro/Yen pair, the key levels are 131.11, 130.90, 130.58. 130.28, 130.13, 129.67, 129.46, and 129.15. Here, we are following the development of the July 20 upward structure. The continuation of the upward movement is expected after the price passes the noise range 130.13 - 130.28, in this case, the target is 130.58, with consolidation near this level. A breakout of 130.60 will lead to the development of a pronounced movement with a potential target at 131.11. Upon reaching this, we expect consolidation in the range of 130.90 - 131.11, as well as a rollback to the low.
A short-term downward movement is possible in the 129.67 - 129.46 corridor. A breakdown of the last value will lead to a deep correction with the target at 129.15, which is key support for the high.
The main trend is the upward structure from July 20
Key levels of structure development:
Upward resistance: 130.30 Target: 130.56
Upward resistance: 130.60 Target: 130.90
Downward resistance: 129.66 Target: 129.48
Downward resistance: 129.45 Target: 129.18
For the Pound/Yen pair, the key levels on the H1 scale are 155.18, 154.29, 153.41, 153.03, 152.46, 151.45, 151.04, 150.34, and 150.05. Here, we are following the development of the medium-term upward structure from July 20. At the moment, the price is in a deep correction and is forming a potential low from July 29. The upward movement is expected to resume after the breakout of 152.46 with the initial target at 153.03. Passing by the price of the noise range 153.03 - 153.41 will lead to the development of a pronounced upward movement with the target at 154.29 and consolidation near this level. We consider the level 155.18 as a potential value for the high. Upon reaching this, we expect a rollback to the low.
A short-term downward movement is possible in the range of 152.45 - 151.04. A breakdown of the last value will lead to the development of a downward potential from July 29 with the target at 150.34 and price consolidation in the 150.34 - 150.05 corridor.
The main trend is the medium-term upward structure of July 20, the stage of deep correction.
Key levels of structure development:
Upward resistance: 152.48 Target: 153.03
Upward resistance: 153.42 Target: 154.27
Downward resistance: 151.45 Target: 151.06
Downward resistance: 151.02 Target: 150.36