signal strength 2 of 5

According to the chart of M15, #Bitcoin formed the Bullish Symmetrical Triangle pattern. The lower border of the pattern touches the coordinates 83167.44/83888.94 whereas the upper border goes across 84422.11/83888.94. If the Bullish Symmetrical Triangle pattern is in progress, this evidently signals a further upward trend. In other words, in case the scenario comes true, the price of #Bitcoin will breach the upper border to head for 83889.16.
The M5 and M15 time frames may have more false entry points.
ดูเพิ่มเติม
- All
- Double Top
- Flag
- Head and Shoulders
- Pennant
- Rectangle
- Triangle
- Triple top
- All
- #AAPL
- #AMZN
- #Bitcoin
- #EBAY
- #FB
- #GOOG
- #INTC
- #KO
- #MA
- #MCD
- #MSFT
- #NTDOY
- #PEP
- #TSLA
- #TWTR
- AUDCAD
- AUDCHF
- AUDJPY
- AUDUSD
- EURCAD
- EURCHF
- EURGBP
- EURJPY
- EURNZD
- EURRUB
- EURUSD
- GBPAUD
- GBPCHF
- GBPJPY
- GBPUSD
- GOLD
- NZDCAD
- NZDCHF
- NZDJPY
- NZDUSD
- SILVER
- USDCAD
- USDCHF
- USDJPY
- USDRUB
- All
- M5
- M15
- M30
- H1
- D1
- All
- Buy
- Sale
- All
- 1
- 2
- 3
- 4
- 5
was formed on 22.04 at 11:39:27 (UTC+0)
signal strength 1 of 5
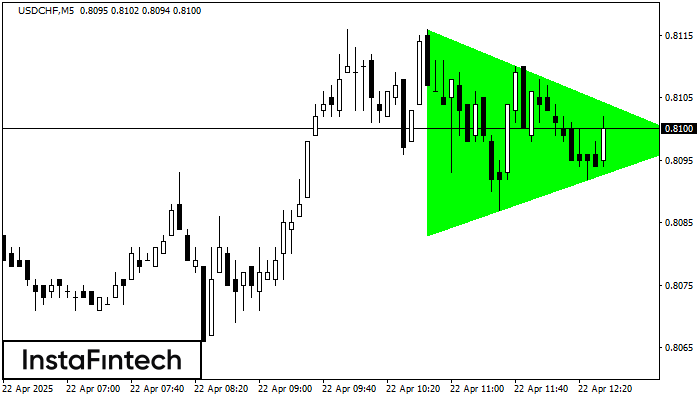
อ้างอิงจากชาร์ตของ M5, USDCHF ที่ได้สร้างรูปแบบ รูปแบบสามเหลี่ยมสมมาตรขาขึ้น (Bullish Symmetrical Triangle) ออกมา ขอบเขตด้านล่างของรูปแบบสัมผัสพิกัด 0.8083/0.8098 แม้ว่าขอบเขตด้านบนจะข้ามผ่าน 0.8116/0.8098 ถ้ารูปแบบ รูปแบบสามเหลี่ยมสมมาตรขาขึ้น
ขอบเตระยะเวลาใน M5 และ M15 อาจจะมีตำแหน่งการเข้าใช้งานที่ผิดพลาดมากยิ่งขึ้น
Open chart in a new window
รูปแบบ รูปแบบกราฟจุดสองยอด (Double Top) ถูกสร้างขึ้นมาใน NZDCAD H1 มันแสดงให้เห็นว่า แนวโน้มได้มีการเปลี่ยนแปลงจากแนวโน้มขาขึ้น ไปเป็นขาลง บางที ถ้ามีการเคลื่อนตัวทะลุผ่าน ฐานของรูปแบบออกไป 0.8276 การเคลื่อนไหวลงด้านล่างจะยังคงเกิดขึ้น
Open chart in a new windowwas formed on 22.04 at 08:55:22 (UTC+0)
signal strength 1 of 5

รูปแบบทางเทคนิค ทำให้เกิด รูปแบบกราฟหัวและหัวไหล่ (Head and Shoulders) ที่ปรากฎออกมาในชาร์ตของ GOLD M5 มีเหตุผลที่หนักแน่นอยู่หลายประการที่แสดงให้เห็นว่า ราคาจะมุ่งหน้าผ่านตำแหน่งส่วนคอ 3473.12/3476.36 หลังจากตำแหน่งส่วนหัวไหล่ด้านขวาได้ถูกสร้างขึ้นมา ดังนั้นแนวโน้มจะมีการเปลี่ยนแปลงพร้อมกับราคาที่จะมุ่งหน้าไปยัง3476.21
ขอบเตระยะเวลาใน M5 และ M15 อาจจะมีตำแหน่งการเข้าใช้งานที่ผิดพลาดมากยิ่งขึ้น
Open chart in a new window