1.How to make money on cryptocurrencies?
2. Analysis of Bitcoin futures volume on Chicago Mercantile Exchange
3. Trend analysis.
4. Japanese candlestick analysis.
5. Conclusion. Statistics.
1.How to make money on cryptocurrencies?
In order to make money on cryptocurrencies, you need to use a working trading system and competent money management. Let's continue to consider money management methods.
Fixed Ratio Money Management Method.
This method implies trading with the same risk in the deposit currency in each transaction. If the stop loss order in the trading system is different in points, the lot in transactions will also change.
Example:
Deposit is $10,000. The fixed amount at risk is $100.
The first trade is a long position on bitcoin, with an entry point at 52,000, a stop-loss order at 48,500, and a trade size of 0.03 lot.
The second trade is a long position on bitcoin, with an entry point at 51,000, a stop-loss order at 49,000, and a trade size of 0.05 lot.
Thus, the trade size must be calculated before each transaction. The more points the stop-loss order has, the smaller the trade size will be. The fewer points the stop-loss order has, the larger the trade size will be. For such calculations, use an excel table with different tools, so that all calculations are made automatically.
What should be the amount at risk? It should be small, within 0.25% - 2% of the initial deposit. Such a small risk will allow you not to worry about possible losses. Even a series of unsuccessful trades will not lead to huge losses.
How often do you need to change the amount at risk? If your deposit grows, you do not need to change the amount too often due to ups and downs in the market. Of course, you can make good money and increase the amount at risk, but a series of losing trades on increased traded volume may result in huge losses. Therefore, there is no point in increasing the amount at risk more frequently than once every 3 months. Thus, an increase in the risk will occur in the accumulated profit.
The fixed risk ratio method can be considered optimal for trading.
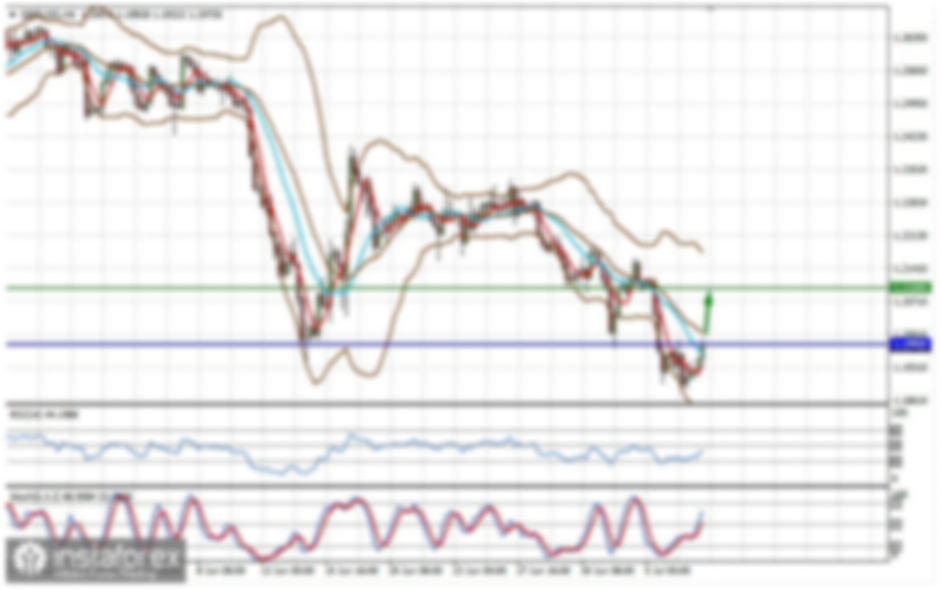
2. Analysis of Bitcoin futures volume on Chicago Mercantile Exchange.
The downward movement was halted. Today, bitcoin has started to trade upwards. The market is rather volatile. In this situation, traders must be extremely careful. Let's consider the levels of the maximum traded volumes based on the Chicago Mercantile Exchange. These indicators show the activity of major market players.
22.04.21 - The level of the maximum traded volume (POC - Point Of Control) - 53725
23.04.21 - The level of the maximum traded volume (POC - Point Of Control) - 49225
The POC has moved down, the price is above the maximum traded volume. The market is moving in a sideways trend. In such a situation, according to the volume analysis, you can open both short and long positions.
3. Trend analysis.
The second step in this analysis is to determine the short-, medium-, and long-term trend. It is worth opening trades when the direction of all three trends coincides. Trend analysis is carried out with the help of an exponential moving average:
EMA 1152 (blue) shows the long-term trend on the H1 chart, which is similar to EMA 48 on the D chart;
EMA 288 (red) shows the medium-term trend on the H1 chart, which is similar to EMA 48 on the H4 chart;
EMA 48 (black) shows the short-term trend on the H1 chart.
The price has risen above EMA 48, but it is still below EMA 288 and EMA 1152. Apparently, a sideways movement is developing in the market. Therefore, according to the trend analysis, it is possible to open both short and long positions today.
4. Japanese candlestick analysis.
Market analysis with the help of Japanese candlesticks is the third step in this trading system. Let's analyze yesterday's daily candlestick:
The candlestick has closed downwards, the candlestick is black. The low is below the low of the previous candlestick. The candlestick pattern matches the trend, it has a long body and small shadows. However, the high of yesterday's candlestick has already been broken. According to the Japanese candlestick analysis, you can consider both buy and sell orders.
5. Conclusion. Statistics.
Volume analysis - BUY SELL.
Long-term trend - SELL.
Medium-term trend - SELL.
Short-term trend - BUY.
Japanese candlestick analysis - BUY SELL.
Conclusion: On April 26, 2021, you can open both long and short positions on bitcoin as the different types of analysis provide different forecasts.
To analyze the effectiveness of this trading approach, you should use statistics. Based on these forecasts, we track the data on completed transactions and open new deals in a separate account. Transactions are made on four instruments: Bitcoin, Ethereum, Litecoin, and BCHUSD. They are analyzed in the same way. Statement:
We continue to keep the short position on bitcoin open.
The risk is not more than 1% per trade, this approach is conservative. According to this system, a stop-loss order is placed beyond the daily low or high, depending on the direction of the trade. We do not set take-profit orders, enabling the price to grow without limits. We follow the trade, moving SL beyond the extreme points of the future sessions.
Since trading is carried out on the daily charts, this recommendation remains relevant throughout the day.
Trade along the trend and you will make a profit!